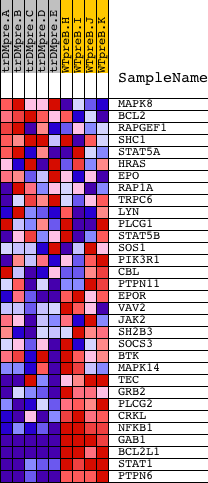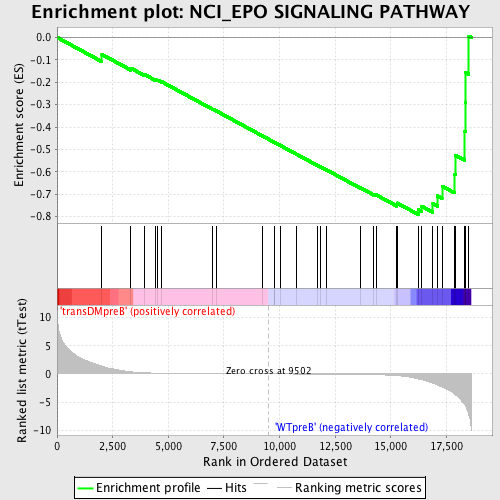
Profile of the Running ES Score & Positions of GeneSet Members on the Rank Ordered List
| Dataset | Set_04_transDMpreB_versus_WTpreB.phenotype_transDMpreB_versus_WTpreB.cls #transDMpreB_versus_WTpreB |
| Phenotype | phenotype_transDMpreB_versus_WTpreB.cls#transDMpreB_versus_WTpreB |
| Upregulated in class | WTpreB |
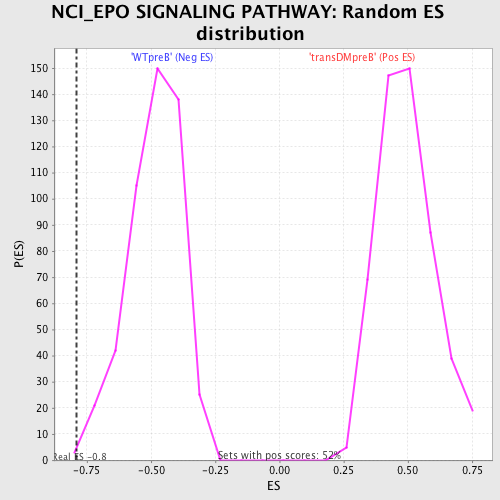
| GeneSet | NCI_EPO SIGNALING PATHWAY |
| Enrichment Score (ES) | -0.79025763 |
| Normalized Enrichment Score (NES) | -1.6309571 |
| Nominal p-value | 0.0020661156 |
| FDR q-value | 0.043321837 |
| FWER p-Value | 0.382 |
| PROBE | DESCRIPTION (from dataset) | GENE SYMBOL | GENE_TITLE | RANK IN GENE LIST | RANK METRIC SCORE | RUNNING ES | CORE ENRICHMENT | |
|---|---|---|---|---|---|---|---|---|
| 1 | MAPK8 | 6459 | 2014 | 1.381 | -0.0760 | No | ||
| 2 | BCL2 | 8651 3928 13864 4435 981 4062 13863 4027 | 3317 | 0.365 | -0.1375 | No | ||
| 3 | RAPGEF1 | 4218 2860 | 3925 | 0.206 | -0.1653 | No | ||
| 4 | SHC1 | 9813 9812 5430 | 4421 | 0.139 | -0.1887 | No | ||
| 5 | STAT5A | 20664 | 4510 | 0.131 | -0.1903 | No | ||
| 6 | HRAS | 4868 | 4707 | 0.115 | -0.1982 | No | ||
| 7 | EPO | 8911 | 6998 | 0.035 | -0.3206 | No | ||
| 8 | RAP1A | 8467 | 7142 | 0.032 | -0.3275 | No | ||
| 9 | TRPC6 | 19565 | 9241 | 0.003 | -0.4403 | No | ||
| 10 | LYN | 16281 | 9750 | -0.003 | -0.4676 | No | ||
| 11 | PLCG1 | 14753 | 9775 | -0.004 | -0.4688 | No | ||
| 12 | STAT5B | 20222 | 10037 | -0.007 | -0.4827 | No | ||
| 13 | SOS1 | 5476 | 10751 | -0.016 | -0.5207 | No | ||
| 14 | PIK3R1 | 3170 | 11694 | -0.031 | -0.5706 | No | ||
| 15 | CBL | 19154 | 11843 | -0.033 | -0.5778 | No | ||
| 16 | PTPN11 | 5326 16391 9660 | 12087 | -0.038 | -0.5900 | No | ||
| 17 | EPOR | 19204 | 13643 | -0.088 | -0.6716 | No | ||
| 18 | VAV2 | 5848 2670 | 14239 | -0.130 | -0.7006 | No | ||
| 19 | JAK2 | 23893 9197 3706 | 14343 | -0.140 | -0.7028 | No | ||
| 20 | SH2B3 | 5001 16383 | 15271 | -0.301 | -0.7456 | No | ||
| 21 | SOCS3 | 20131 | 15281 | -0.304 | -0.7390 | No | ||
| 22 | BTK | 24061 | 16235 | -0.895 | -0.7693 | Yes | ||
| 23 | MAPK14 | 23313 | 16395 | -1.021 | -0.7539 | Yes | ||
| 24 | TEC | 16514 | 16891 | -1.651 | -0.7418 | Yes | ||
| 25 | GRB2 | 20149 | 17099 | -1.953 | -0.7071 | Yes | ||
| 26 | PLCG2 | 18453 | 17303 | -2.308 | -0.6639 | Yes | ||
| 27 | CRKL | 4560 | 17866 | -3.568 | -0.6105 | Yes | ||
| 28 | NFKB1 | 15160 | 17907 | -3.696 | -0.5260 | Yes | ||
| 29 | GAB1 | 18828 | 18330 | -5.503 | -0.4197 | Yes | ||
| 30 | BCL2L1 | 4440 2930 8652 | 18346 | -5.613 | -0.2888 | Yes | ||
| 31 | STAT1 | 3936 5524 | 18359 | -5.675 | -0.1564 | Yes | ||
| 32 | PTPN6 | 17002 | 18509 | -7.257 | 0.0058 | Yes |